Randomization, Contrasts,
and one-way ANOVA
STAT 6160 • Experimental Design • Fall 2026
Siddharth Vishwanath
Agenda
\[ \newcommand{\pa}[1]{\left(#1\right)} \newcommand{\pb}[1]{\left\{#1\right\}} \newcommand{\pc}[1]{\left[#1\right]} \newcommand{\pA}[1]{\Big(#1\Big)} \newcommand{\pB}[1]{\Big\{#1\Big\}} \newcommand{\pC}[1]{\Big[#1\Big]} \newcommand{\eq}[1]{\begin{align}{#1}\end{align}} \newcommand{\eref}[1]{Eq.~\eqref{#1}} \newcommand{\pref}[1]{part~(\ref{#1})} \newcommand{\nn}{\nonumber} \newcommand{\n}{\nonumber\\} \newcommand{\f}{\frac} \newcommand{\defeq}{\stackrel{\small\bullet}{=}} \newcommand{\ra}{\rangle} \newcommand{\la}{\langle} \newcommand{\norm}[1]{\left\|#1\right\|} \newcommand{\abs}[1]{\left\lvert#1\right\rvert} \newcommand{\Abs}[1]{\Bigl\lvert#1\Bigr\rvert} \newcommand{\pr}{{\mathbb P}} \newcommand{\qr}{{\mathbb Q}} \newcommand{\xv}{{\boldsymbol{x}}} \newcommand{\av}{{\boldsymbol{a}}} \newcommand{\bv}{{\boldsymbol{b}}} \newcommand{\cv}{{\boldsymbol{c}}} \newcommand{\dv}{{\boldsymbol{d}}} \newcommand{\ev}{{\boldsymbol{e}}} \newcommand{\fv}{{\boldsymbol{f}}} \newcommand{\gv}{{\boldsymbol{g}}} \newcommand{\hv}{{\boldsymbol{h}}} \newcommand{\nv}{{\boldsymbol{n}}} \newcommand{\sv}{{\boldsymbol{s}}} \newcommand{\tv}{{\boldsymbol{t}}} \newcommand{\uv}{{\boldsymbol{u}}} \newcommand{\vv}{{\boldsymbol{v}}} \newcommand{\wv}{{\boldsymbol{w}}} \newcommand{\zerov}{{\mathbf{0}}} \newcommand{\onev}{{\mathbf{1}}} \newcommand{\phiv}{{\boldsymbol{\phi}}} \newcommand{\cc}{{\check{C}}} \newcommand{\xv}{{\boldsymbol{x}}} \newcommand{\Xv}{{\boldsymbol{X}\!}} \newcommand{\yv}{{\boldsymbol{y}}} \newcommand{\Yv}{{\boldsymbol{Y}}} \newcommand{\zv}{{\boldsymbol{z}}} \newcommand{\Zv}{{\boldsymbol{Z}}} \newcommand{\Iv}{{\boldsymbol{I}}} \newcommand{\Jv}{{\boldsymbol{J}}} \newcommand{\Cv}{{\boldsymbol{C}}} \newcommand{\Ev}{{\boldsymbol{E}}} \newcommand{\Fv}{{\boldsymbol{F}}} \newcommand{\Gv}{{\boldsymbol{G}}} \newcommand{\Hv}{{\boldsymbol{H}}} \newcommand{\alphav}{{\boldsymbol{\alpha}}} \newcommand{\epsilonv}{{\boldsymbol{\epsilon}}} \newcommand{\betav}{{\boldsymbol{\beta}}} \newcommand{\deltav}{{\boldsymbol{\delta}}} \newcommand{\gammav}{{\boldsymbol{\gamma}}} \newcommand{\etav}{{\boldsymbol{\eta}}} \newcommand{\piv}{{\boldsymbol{\pi}}} \newcommand{\thetav}{{\boldsymbol{\theta}}} \newcommand{\tauv}{{\boldsymbol{\tau}}} \newcommand{\muv}{{\boldsymbol{\mu}}} \newcommand{\argmin}{\mathop{\text{arg}\ \!\text{min}}} \newcommand{\arginf}{\mathop{\text{arg}\ \!\text{inf}}} \newcommand{\argmax}{\mathop{\text{arg}\ \!\text{max}}} \newcommand{\argsup}{\mathop{\text{arg}\ \!\text{sup}}} \newcommand{\f}{\frac} \newcommand{\e}{\epsilon} \newcommand{\b}{\bullet} \newcommand{\inv}{^{-1}} \newcommand{\A}{{\mathcal A}} \newcommand{\C}{{\mathbb C}} \newcommand{\E}{{\mathbb E}} \newcommand{\F}{{\mathcal{F}}} \newcommand{\N}{{\mathbb N}} \newcommand{\R}{{\mathbb R}} \newcommand{\Q}{{\mathbb Q}} \newcommand{\Z}{{\mathbb Z}} \newcommand{\X}{{\mathbb{X}}} \newcommand{\Y}{{\mathbb{Y}}} \newcommand{\G}{{\mathcal{G}}} \newcommand{\M}{{\mathcal{M}}} \newcommand{\Xn}{X_1, \dots, X_n} \newcommand{\Xm}{X_1, \dots, X_m} \newcommand{\Yn}{Y_1, \dots, Y_n} \newcommand{\Ym}{Y_1, \dots, Y_m} \newcommand{\Xb}{{\mathbb{X}}} \newcommand{\Yb}{{\mathbb{Y}}} \newcommand{\s}{{{\sigma}}} %%%%%%%%%%%%%%%%%%%%%%%%%%% \newcommand{\c}{^c} \newcommand{\bar}{\overline} \newcommand{\indep}{\perp\kern-6pt \perp} \newcommand{\pr}{{\mathbb P}} \newcommand{\R}{{\mathbb R}} \newcommand{\E}{{\mathbb E}} \newcommand{\var}{\text{Var}} \newcommand{\sd}{\text{SD}} \newcommand{\se}{\text{SE}} \newcommand{\ssres}{{\mathrm{SS}_{\mathrm{Res}}}} \newcommand{\sstrt}{{\mathrm{SS}_{\mathrm{Trt}}}} \newcommand{\sstot}{{\mathrm{SS}_{\mathrm{Tot}}}} \newcommand{\rank}{\mathop{\mathrm{rank}}} \newcommand{\supp}{\text{supp}} \newcommand{\Unif}{{\text{Unif}}} \newcommand{\Ber}{{\text{Ber}}} \newcommand{\Bin}{{\text{Bin}}} \newcommand{\Geo}{{\text{Geo}}} \newcommand{\Poi}{{\text{Poi}}} \newcommand{\Exp}{{\text{Exp}}} \newcommand{\Chisq}{{\chi^2}} \newcommand{\iid}{{\stackrel{iid}{\sim}}} \newcommand{\px}{p_{X}} \newcommand{\py}{p_{Y}} \newcommand{\pxy}{p_{X,Y}} \newcommand{\fx}{f_{X}} \newcommand{\fz}{f_{Z}} \newcommand{\fy}{f_{Y}} \newcommand{\fxy}{f_{X,Y}} \newcommand{\Fx}{F_{X}} \newcommand{\Fz}{F_{Z}} \newcommand{\Fy}{F_{Y}} \newcommand{\Fxy}{F_{X,Y}} \newcommand{\Xbar}{\overline{X}} \newcommand{\Ybar}{\overline{Y}} \newcommand{\Zbar}{\overline{Z}} \newcommand{\nXbar}{n \cdot \overline{X}} \newcommand{\nYbar}{n \cdot \overline{Y}} \newcommand{\nZbar}{n \cdot \overline{Z}} \newcommand{\Xn}{X_1, X_2, \dots, X_n} \newcommand{\Xm}{X_1, X_2, \dots, X_m} \newcommand{\Ym}{Y_1, Y_2, \dots, Y_m} \newcommand{\sumXn}{X_1 + X_2 + \dots + X_n} \newcommand{\la}{\ell_\alpha} \newcommand{\ua}{u_\alpha} \newcommand{\at}{{\alpha/2}} %%\renewcommand{\hat}{\widehat} \newcommand{\mux}{\mu_{X}} \newcommand{\muy}{\mu_{Y}} \newcommand{\sx}{\sigma_{X}} \newcommand{\sy}{\sigma_{Y}} \newcommand{\pvalue}{$p$-value} \newcommand{\Ho}{H_{0}} \newcommand{\Ha}{H_{a}} \]
§1. Notation
§2. The completely randomized design
§3. Randomization
§4. One-way ANOVA
§5. Multiple comparisons
§6. Contrasts
§1. Notation
Indices
\[y_{ij} = \text{observation of unit $j$ on treatment $i$}, \\ i = 1,\ldots,g, \quad j = 1,\ldots,n_i\]
\(g\) treatments
- (e.g., \(g=3\) when we have
placebo,treatment 1andtreatment 2)
- (e.g., \(g=3\) when we have
\(n_i\) units on each treatment \(i\)
- (e.g., \(n_1\) units on
placebo, \(n_2\) units ontreatment 1, and \(n_3\) units ontreatment 2)
- (e.g., \(n_1\) units on
The total number of experimental units is \(\displaystyle N = \sum_{i=1}^{g} n_i\)
Balanced means when:
- \(n_1 = \cdots = n_g = n\), so \(N = gn\)
The dot convention
A dot replaces an index that has been averaged over.
\[ \bar y_{i\b} \ = \ \frac{1}{n_i}\sum_{j=1}^{n_i} y_{ij}, \qquad \bar y_{\b j} \ = \ \frac{1}{g}\sum_{i=1}^{g} y_{ij}, \qquad \bar y_{\b\b} \ = \ \frac{1}{N}\sum_{i=1}^{g}\sum_{j=1}^{n_i} y_{ij} \]
- \(\bar y_{i\b}\) : treatment mean
- \(\bar y_{\b j}\) : mean across treatments at position \(j\) (defined when \(n_i \equiv n\))
- \(\bar y_{\b\b}\) : grand mean
- In the balanced case:
- \(\displaystyle\bar y_{\b\b} = \frac{1}{g}\sum_i \bar y_{i\b}\);
- in general:
- \(\displaystyle\bar y_{\b\b} = \frac{1}{N}\sum_i n_i \bar y_{i\b}\)
§2. The completely randomized design
The smallest experiment
Two treatments, \(n_1\) and \(n_2\) units.
\[ \begin{aligned} y_{ij} &= \mu + \tau_i + \e_{ij}, &\qquad \e_{ij} &\iid \mathcal{N}(0,\sigma^2) \\ &i = 1,2, & j &= 1,\ldots,n_i \end{aligned} \]
- Target \(\Delta \ = \ \E(y_{1j}) - \E(y_{2j}) \ = \ \tau_1 - \tau_2\)
- \(\hat\Delta = \bar y_{1\b} - \bar y_{2\b}\), and \(s_p^2\) pools the two within-group variances
\[ t \ = \ \frac{\hat\Delta - \Delta}{s_p\sqrt{1/n_1 + 1/n_2}} \ \sim \ t_{(n_1+n_2-2)} \]
The same test as a regression
\[ y_i \ = \ \beta_0 + \beta_1 w_i + \e_i, \qquad w_i = \begin{cases} 0 & \text{treatment 1} \\ 1 & \text{treatment 2}\end{cases} \]
\[ \Xv \ = \ \pc{\ \onev \ \ \ \wv \ }, \qquad \hat\beta_1 = \bar y_{2\b} - \bar y_{1\b}, \qquad \pa{(\Xv^\top\Xv)^{-1}}_{22} = \frac{1}{n_1} + \frac{1}{n_2} \]
- \(H_0 : \beta_1 = 0\) is the one-row general linear hypothesis \(\cv^\top\betav = 0\)
- \(\tau_2 - \tau_1\) is estimable; \(\tau_1\) and \(\tau_2\) separately are not
Why only the difference is identified
The two treatment means are
\[ \mu_1 = \mu + \tau_1, \qquad \mu_2 = \mu + \tau_2. \]
For any number \(\eta\), shifting the parameters gives exactly the same two means:
\[ \mu + \tau_i = (\mu - \eta) + (\tau_i + \eta), \qquad i = 1,2. \]
Thus \(\tau_1-\tau_2\) is unchanged, but neither \(\tau_1\) nor \(\tau_2\) has a unique value. The treatment-effects design matrix is
\[ \underbrace{ \begin{pmatrix} \onev_{n_1} & \onev_{n_1} & \zerov_{n_1} \\ \onev_{n_2} & \zerov_{n_2} & \onev_{n_2} \end{pmatrix} }_{\Xv_{\tau}\ \in\ \R^{N\times3},\quad \rank(\Xv_{\tau})=2} \qquad \begin{pmatrix}\mu\\\tau_1\\\tau_2\end{pmatrix}. \]
The shorthand \(\Xv_{\tau} = [\onev\ \zv_1\ \zv_2]\) is convenient. Since
\[ \qquad \onev = \zv_1 + \zv_2, \]
the first column is already the sum of the other two.
With the usual reference-cell dummy encoding, instead drop the second column (\(\zv_1\)):
\[ \Xv_{\mathrm{ref}} = \pc{\ \onev\ \ \zv_2\ }, \qquad \beta_0 = \mu_1, \qquad \beta_1 = \mu_2 - \mu_1. \]
HW: Why?
Four assumptions
\[ (\text{A1 }) \e_i \sim \mathcal{N}(0,\sigma^2) \qquad (\text{A2 }) \var(\e_i) \text{ free of } w_i \qquad (\text{A3 }) \e_i \text{ independent} \\ (\text{A4 }) w_i \text{ is unrelated to omitted } u_i \]
- (\(A1\)): CLT limits the damage
- (\(A2\)): little damage when \(n_1 = n_2\); otherwise Welch, \(\sqrt{s_1^2/n_1 + s_2^2/n_2}\)
- (\(A3\)): violations are hard to detect
- (\(A4\)) is a design risk, not a distributional assumption. Consider
\[ \E(y_i) = \beta_0 + \beta_1 w_i + \beta_2 u_i. \]
Leaving out \(u_i\) is harmful when it is systematically associated with treatment. * Complete randomization makes that association average to zero over the randomization; it does not make \(u_i\) disappear from an individual experiment
The design decision
- \(N\) units, \(g\) treatments, group sizes \(n_1,\ldots,n_g\) fixed in advance
- The experimenter chooses the map from units to treatments, and nothing else
- Completely randomized design: that map is drawn uniformly over all \(\displaystyle \binom{N}{n_1,\ n_2,\ \ldots,\ n_g}\) allocations
- Alternatives in use: systematic order, alternation, convenience order
§3. Randomization
Setup
Two thumbnail designs, A and B, on one account. Ten posting slots \(i = 1,\ldots,10\), one per hour, five slots per design. Response \(y_i\) is engagement in the hour after the post.
S1. Blocked
AAAAABBBBB
S2. Alternating
ABABABABAB
S3. Randomized
ABBBAABAAB
The error structure
\[ \hat\Delta - \Delta \ = \ \frac{1}{5}\sum_{i=1}^{10} v_i\,\e_i \]
\[ v_i \ = \ \begin{cases} +1 & \text{slot } i \text{ gets A}\\ -1 & \text{slot } i \text{ gets B} \end{cases} \]
S1. Blocked
AAAAABBBBB
\[ \frac{1}{5}\left(\sum_{i=1}^{5}\e_i - \sum_{i=6}^{10}\e_i\right) \]
S2. Alternating
ABABABABAB
\[ \frac{1}{5}\sum_{i=1}^{10}(-1)^{i+1}\e_i \]
S3. Randomized
ABBBAABAAB
\[ \frac{1}{5}\sum_{i=1}^{10}v_i\e_i \]
Bias from an omitted trend
Engagement drifts through the day: \(u_i = c\,(i - 5.5)\), absorbed into \(\e_i\).
\[ \E\big(\hat\Delta\big) - \Delta \ = \ \frac{c}{5}\sum_{i=1}^{10} v_i\,(i - 5.5) \]
AAAAABBBBB
\[ \sum_i v_i(i-5.5) = -25 \] \[ \text{bias} = -5c \]
ABABABABAB
\[ \sum_i v_i(i-5.5) = -5 \] \[ \text{bias} = -c \]
ABBBAABAAB
\[ \sum_i v_i(i-5.5) = 3 \] \[ \text{bias} = 0.6c \]
Alternation has its own blind spot
Suppose engagement alternates for an unrecorded reason: \(u_i = c\,(-1)^i\). Then
\[ \E\big(\hat\Delta\big) - \Delta \ = \ \frac{c}{5}\sum_{i=1}^{10} v_i(-1)^i \]
| Schedule | \(\sum_i v_i(-1)^i\) | Bias |
|---|---|---|
| S1: blocked | \(0\) | \(0\) |
| S2: alternating | \(-10\) | \(-2c\) |
| S3: randomized | \(-2\) | \(-0.4c\) |
Randomization is not magic for one realized allocation. Its protection is that, over the draw, the bias is centered at zero for any fixed pattern \(u_i\).
Variance under adjacent correlation
\[ \mathrm{corr}(y_i, y_{i'}) \ = \ \begin{cases} 1 & i = i'\\ \rho & |i - i'| = 1\\ 0 & \text{else} \end{cases} \qquad\Longrightarrow\qquad \var\big(\hat\Delta\big) \ = \ \frac{\sigma^2}{25}\pa{10 + 2\rho\sum_{i=1}^{9} v_i v_{i+1}} \]
AAAAABBBBB
\[ \textstyle\sum_i v_i v_{i+1} = 7 \] \[ \tfrac{2\sigma^2}{5} + \tfrac{14\rho\sigma^2}{25} \]
ABABABABAB
\[ \textstyle\sum_i v_i v_{i+1} = -9 \] \[ \tfrac{2\sigma^2}{5} - \tfrac{18\rho\sigma^2}{25} \]
ABBBAABAAB
\[ \textstyle\sum_i v_i v_{i+1} = -1 \] \[ \tfrac{2\sigma^2}{5} - \tfrac{2\rho\sigma^2}{25} \]
The reported standard error uses \(\rho = 0\) in all three cases.
Drawing an allocation
- Permute the unit labels, cut into groups of sizes \(n_1,\ldots,n_g\)
- Assignment order and measurement order are separate randomizations
- Restricted randomization: re-draw when the realized allocation is unbalanced on a known covariate
- The realized allocation is part of the data
§4. One-way ANOVA
From two treatments to \(g\)
\[ \begin{aligned} y_{ij} &= \mu + \tau_i + \e_{ij}, &\qquad \e_{ij} &\iid \mathcal{N}(0,\sigma^2) \\ &i = 1,\ldots,g, & j &= 1,\ldots,n_i \end{aligned} \]
- \(g = 2\) gives §2, and \(H_0 : \tau_1 = \tau_2\) is the two-sample \(t\)-test
- \(g > 2\): \(H_0 : \tau_1 = \cdots = \tau_g\) is \(g-1\) restrictions, not one
- (Alternatively) Cell-mean form:
\[ y_{ij} = \mu_i + \e_{ij}, \qquad \mu_i = \mu + \tau_i \]
- There are \(g\) group means but \(g+1\) symbols in \((\mu,\tau_1,\ldots,\tau_g)\).
Why one-way ANOVA needs a constraint
Let \(\zv_i\) indicate membership in treatment \(i\). The treatment-effects design matrix is
\[ \underbrace{ \begin{pmatrix} \onev_{n_1} & \onev_{n_1} & \zerov_{n_1} & \cdots & \zerov_{n_1} \\ \onev_{n_2} & \zerov_{n_2} & \onev_{n_2} & \cdots & \zerov_{n_2} \\ \vdots & \vdots & \vdots & \ddots & \vdots \\ \onev_{n_g} & \zerov_{n_g} & \zerov_{n_g} & \cdots & \onev_{n_g} \end{pmatrix} }_{\Xv_{\tau}\ \in\ \R^{N\times(g+1)},\quad \rank(\Xv_{\tau})=g} \qquad \begin{pmatrix}\mu\\\tau_1\\\tau_2\\\vdots\\\tau_g\end{pmatrix}. \]
The shorthand \(\Xv_{\tau} = [\onev\ \zv_1\ \cdots\ \zv_g]\) is convenient. Since \(\onev = \zv_1 + \zv_2 + \cdots + \zv_g\), it has \(g+1\) columns but rank only \(g\): one column is redundant. Equivalently, for every \(\eta\),
\[ \mu + \tau_i = (\mu - \eta) + (\tau_i + \eta), \qquad i = 1,\ldots,g. \]
The fitted group means do not change. A constraint simply chooses one coordinate system for the same fitted values:
\[ \sum_i n_i\tau_i=0 \quad \text{(deviations from the weighted grand mean)}, \qquad \tau_1=0 \quad \text{(treatment 1 as reference)}, \]
or use the \(g\) cell means directly and omit \(\mu\).
With reference-cell dummy encoding, drop the second column (\(\zv_1\)):
\[ \Xv_{\mathrm{ref}} = \pc{\ \onev\ \ \zv_2\ \ \cdots\ \ \zv_g\ }, \qquad \gamma_0 = \mu_1, \qquad \gamma_{i-1} = \mu_i - \mu_1, \quad i = 2,\ldots,g. \]
The intercept is the treatment-1 mean; every other coefficient is that treatment’s difference from treatment 1. The fitted group means are unchanged.
Diet Restriction and Longevity
Does restricting food intake extend the lives of mice?
349 female mice were randomly assigned to six diets; the response is lifetime in months. (Weindruch et al. 1986; Ramsey and Schafer 2013)
| Diet | What the mice received | \(n_i\) |
|---|---|---|
| A: (N/N85) | Normal before weaning; 85 kcal/week afterward | 57 |
| B: (NP) | Unlimited standard, nonpurified food | 49 |
| C: (N/R50) | Normal before weaning; 50 kcal/week afterward | 71 |
| D: (R/R50) | Restriction before and after weaning; 50 kcal/week afterward | 56 |
| E: (lopro) | As C, with protein reduced as mice aged | 56 |
| F: (N/R40) | Normal before weaning; 40 kcal/week afterward | 60 |
We use A as the reference for comparisons of restricted regimens. B is a separate standard-diet benchmark.
Diet Restriction and Longevity: scatter plot
import pandas as pd
import numpy as np
import matplotlib.pyplot as plt

d = pd.read_csv("data/longevity.csv")
order = ["A", "B", "C", "D", "E", "F"]
colors = ["gray", "#0072B2", "#E69F00",
          "#009E73", "#CC79A7", "#D55E00"]
rng = np.random.default_rng(6160)

fig, ax = plt.subplots()
for i, (diet, color) in enumerate(zip(order, colors)):
    y = d.loc[d.Diet == diet, "Lifetime"]
    x = i + rng.uniform(-0.15, 0.15, len(y))
    ax.scatter(x, y, color=color, alpha=0.65)
ax.set(xticks=range(6), xticklabels=order,
       ylabel="Lifetime (months)")
fig.tight_layout()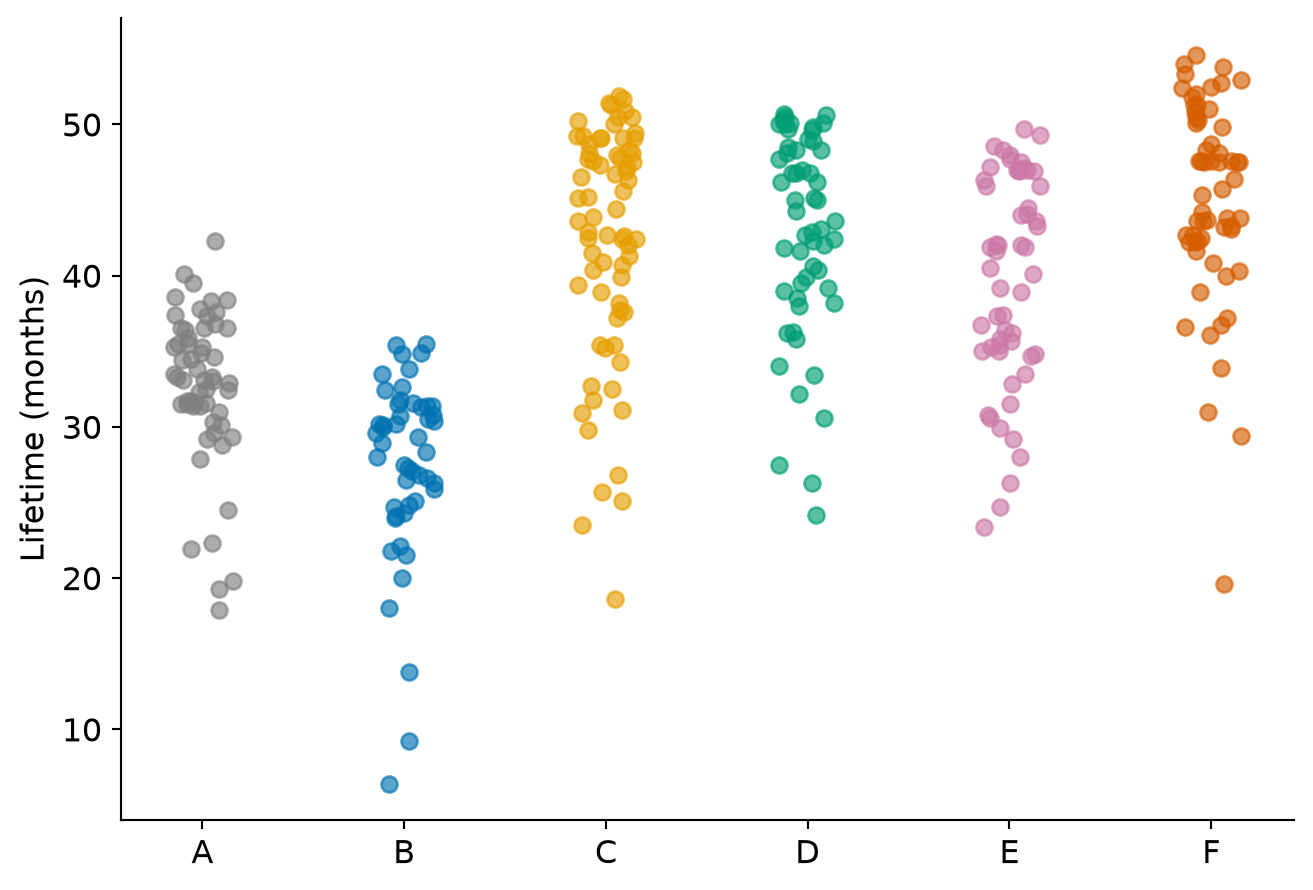
Small horizontal offsets separate overlapping points within each diet.
Diet Restriction and Longevity: boxplot
groups = [
    d.loc[d.Diet == diet, "Lifetime"]
    for diet in order
]

fig, ax = plt.subplots()
boxes = ax.boxplot(
    groups, tick_labels=order,
    patch_artist=True
)
for box, color in zip(boxes["boxes"], colors):
    box.set_facecolor(color)
    box.set_alpha(0.65)
ax.set_ylabel("Lifetime (months)")
fig.tight_layout()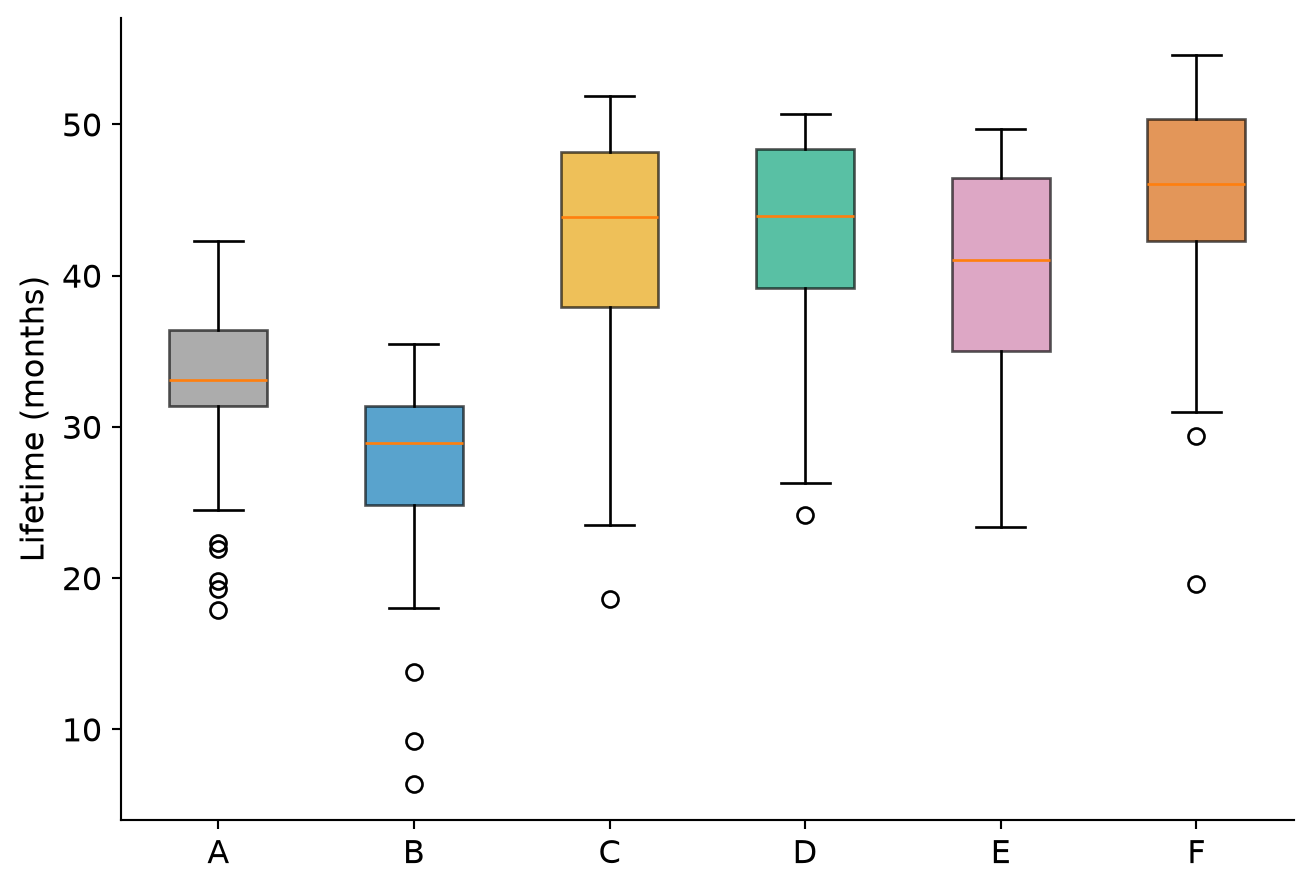
Which differences look large relative to the spread within a diet?
Diet Restriction and Longevity: The model
For mouse \(j\) receiving diet \(i\), \[ y_{ij}=\mu_i+\e_{ij},\qquad \e_{ij}\iid\mathcal N(0,\sigma^2), \quad i=1,\ldots,6,\quad j=1,\ldots,n_i. \]
- \(\mu_i\): mean lifetime under diet \(i\).
- \(\sigma\): within-diet standard deviation, assumed common to all six diets.
- Equivalent treatment-effects form: \(\mu_i=\mu+\tau_i\).
\[ H_0:\mu_1=\cdots=\mu_6 \qquad\text{versus}\qquad H_A:\text{at least one mean differs}. \] This tests equality of all six means, including the B group.
Diet Restriction and Longevity: The design matrix
Order the groups as A, B, C, D, E, F. With A as reference, the design matrix in block form is
\[ \Xv = \underbrace{ \begin{pmatrix} \onev_{57} & \zerov_{57} & \zerov_{57} & \zerov_{57} & \zerov_{57} & \zerov_{57} \\ \onev_{49} & \onev_{49} & \zerov_{49} & \zerov_{49} & \zerov_{49} & \zerov_{49} \\ \onev_{71} & \zerov_{71} & \onev_{71} & \zerov_{71} & \zerov_{71} & \zerov_{71} \\ \onev_{56} & \zerov_{56} & \zerov_{56} & \onev_{56} & \zerov_{56} & \zerov_{56} \\ \onev_{56} & \zerov_{56} & \zerov_{56} & \zerov_{56} & \onev_{56} & \zerov_{56} \\ \onev_{60} & \zerov_{60} & \zerov_{60} & \zerov_{60} & \zerov_{60} & \onev_{60} \end{pmatrix} }_{349\times6,\quad \rank(\Xv)=6}. \]
Here \(\onev_n\) and \(\zerov_n\) are \(n\times1\) vectors of ones and zeros.
The intercept is \(\mu_{\mathrm{A}}\); the other coefficients are \(\mu_i-\mu_{\mathrm{A}}\). The fitted value for every mouse is its diet’s sample mean.
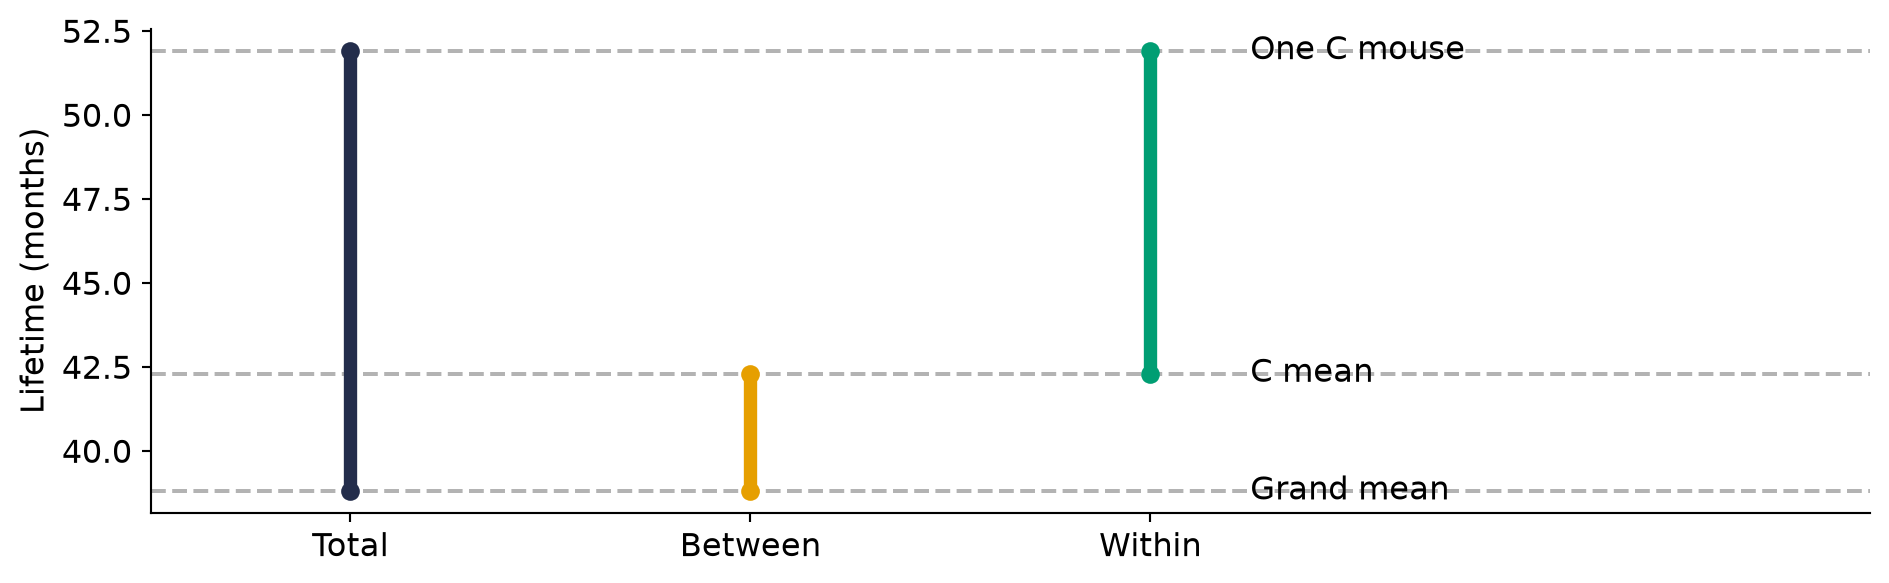
Between-diet and within-diet variation
\[ \underbrace{y_{ij}-\bar y_{\b\b}}_{\text{total deviation}} = \underbrace{\bar y_{i\b}-\bar y_{\b\b}}_{\text{between diets}} + \underbrace{y_{ij}-\bar y_{i\b}}_{\text{within diet}}. \]
From deviations to sums of squares
\[ \underbrace{\sum_{i,j}(y_{ij}-\bar y_{\b\b})^2}_{\sstot} = \underbrace{\sum_i n_i(\bar y_{i\b}-\bar y_{\b\b})^2}_{\sstrt} + \underbrace{\sum_{i,j}(y_{ij}-\bar y_{i\b})^2}_{\ssres}. \]
- Between: how far the six diet means lie from the grand mean, weighted by group size.
- Within: how much individual lifetimes vary around their own diet mean.
Why does the cross term vanish? \[ \sum_{i,j}(\bar y_{i\b}-\bar y_{\b\b})(y_{ij}-\bar y_{i\b}) =\sum_i(\bar y_{i\b}-\bar y_{\b\b}) \underbrace{\sum_j(y_{ij}-\bar y_{i\b})}_{0}=0. \]
The geometry and degrees of freedom
\[ \mathbb R^{349} = \underbrace{\mathrm{span}(\onev)}_{1} \oplus \underbrace{\bigl(\mathcal C(\Xv)\cap\onev^\perp\bigr)}_{5} \oplus \underbrace{\mathcal C(\Xv)^\perp}_{343}. \]
- One grand mean.
- Six fitted diet means minus one grand mean: \(g-1=5\) between-diet degrees of freedom.
- 349 observations minus six fitted means: \(N-g=343\) residual degrees of freedom.
The centered response has \(348=5+343\) degrees of freedom. Orthogonal components give the sums-of-squares identity by Pythagoras.
The null distribution of the F statistic
Under \(H_0\) and the normal, common-variance model, \[ \frac{\sstrt}{\sigma^2}\sim\chi^2_{5},\qquad \frac{\ssres}{\sigma^2}\sim\chi^2_{343}, \quad\text{independently}. \]
Therefore both mean squares estimate the same \(\sigma^2\) under \(H_0\): \[ F=\frac{\sstrt/5}{\ssres/343}\sim F_{5,343}. \]
When diet means differ, the expected treatment mean square increases: \[ \E(\mathrm{MS_{trt}})=\sigma^2+ \frac{\sum_i n_i(\mu_i-\mu_w)^2}{g-1}, \qquad \mu_w=\frac{\sum_i n_i\mu_i}{N}. \] Large values of \(F\) provide evidence against equality of the diet means.
The ANOVA table
| Source | df | Sum of squares | Mean square |
|---|---|---|---|
| Diet | \(g-1=5\) | \(\sstrt\) | \(\sstrt/5\) |
| Residual | \(N-g=343\) | \(\ssres\) | \(\ssres/343\) |
| Total | \(N-1=348\) | \(\sstot\) |
\[ F=\frac{\mathrm{MS_{trt}}}{\mathrm{MS_{res}}}, \qquad \hat\sigma=\sqrt{\mathrm{MS_{res}}}, \qquad R^2=\frac{\sstrt}{\sstot}. \]
Unequal group sizes change the weights, not this decomposition.
Diet Restriction and Longevity: Linear model
import statsmodels.formula.api as smf

# First category becomes the reference.
d["Diet"] = pd.Categorical(
    d.Diet, categories=order
)
fit = smf.ols(
    "Lifetime ~ C(Diet)", data=d
).fit()

coef = pd.DataFrame({
    "Estimate": fit.params,
    "SE": fit.bse
})
coef.index = ["A mean"] + [
    diet + " - A" for diet in order[1:]
]
coef.round(2)| Estimate | SE | |
|---|---|---|
| A mean | 32.69 | 0.88 |
| B - A | -5.29 | 1.30 |
| C - A | 9.61 | 1.19 |
| D - A | 10.19 | 1.26 |
| E - A | 6.99 | 1.26 |
| F - A | 12.43 | 1.24 |
The intercept is a mean in months; every other estimate is a difference in months. These standard errors pool within-diet variation from all six groups.
Diet Restriction and Longevity: ANOVA Table
| df | sum_sq | mean_sq | F | PR(>F) | |
|---|---|---|---|---|---|
| C(Diet) | 5.0 | 12733.942 | 2546.788 | 57.104 | 0.0 |
| Residual | 343.0 | 15297.415 | 44.599 | NaN | NaN |
\(F_{5,343}=57.10\), \(p=4.11e-43\); \(\hat\sigma=6.68\) months.
We have evidence that the six mean lifetimes are not all equal. Comparisons with A require tests of the individual mean differences.
Diet Restriction and Longevity: check the model
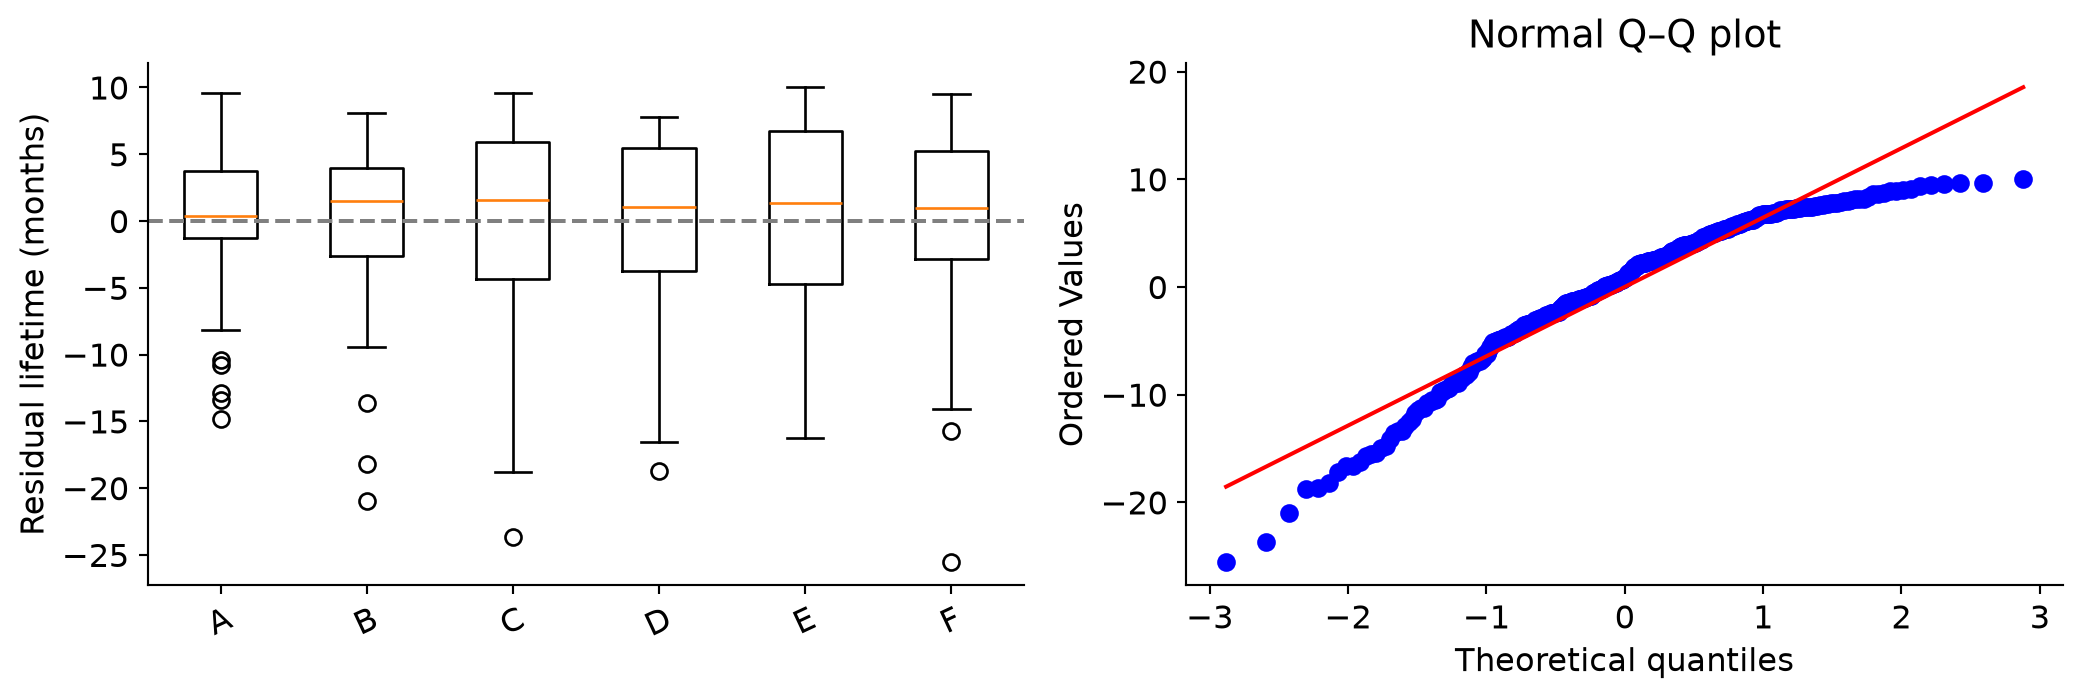
- The plots show differences in spread and departures from normality in the lower tail.
- Assessing independence requires information about housing and how the experiment was run.
- Welch’s ANOVA allows unequal variances; subsequent contrasts also need standard errors that allow unequal variances.
Comparing C and A: 50 and 85 kcal/week
Does reducing the ration from 85 to 50 kcal/week after weaning change mean lifetime?
Groups C and A both received normal feeding before weaning: \[ \theta=\mu_{\mathrm{C}}-\mu_{\mathrm{A}}. \]
In our six-diet order, the coefficients are \[ \cv=(-1,\ 0,\ 1,\ 0,\ 0,\ 0). \] The unrestricted B group is not part of this particular comparison.
Contrasts among diet means
\[ \theta=\sum_i c_i\mu_i,\qquad \sum_i c_i=0. \]
| Question | Coefficients in our diet order |
|---|---|
| C versus A: 50 versus 85 kcal after weaning | \((-1,0,1,0,0,0)\) |
| D versus C: earlier versus later restriction at 50 kcal | \((0,0,-1,1,0,0)\) |
| F versus C: 40 versus 50 kcal after weaning | \((0,0,-1,0,0,1)\) |
| E versus C: reduced protein | \((0,0,-1,0,1,0)\) |
Because the coefficients sum to zero, \(\sum_i c_i\mu_i=\sum_i c_i\tau_i\): the answer is unchanged by the identifiability constraint.
Inference for one contrast
\[ \hat\theta=\sum_i c_i\bar y_{i\b},\qquad \mathrm{se}(\hat\theta)= \sqrt{\mathrm{MS_{res}}\sum_i\frac{c_i^2}{n_i}}. \]
Under \(H_0:\theta=\theta_0\), \[ t=\frac{\hat\theta-\theta_0}{\mathrm{se}(\hat\theta)} \sim t_{343}. \]
A pointwise 95% confidence interval is \[ \hat\theta\pm t_{343}^{0.975}\mathrm{se}(\hat\theta). \]
For C versus A (50 versus 85 kcal), only \(1/71+1/57\) enters the variance multiplier.
Diet Restriction and Longevity: one contrast
| c0 | |
|---|---|
| coef | 9.606 |
| std err | 1.188 |
| t | 8.088 |
| P>|t| | 0.000 |
| Conf. Int. Low | 7.270 |
| Conf. Int. Upp. | 11.942 |
Estimated change: 9.61 months; pointwise 95% CI: (7.27, 11.94) months.
Why does the coefficient vector in the Python call differ from \(\cv\)?
Comparing C–F with A
How does the average of groups C–F (the four restricted regimens) compare with A?
\[ \cv=(-1,0,\tfrac14,\tfrac14,\tfrac14,\tfrac14). \]
This gives each regimen equal weight, despite unequal sample sizes. Pooling all restricted mice would give a different, sample-size-weighted estimand.
Contrasts and the ANOVA decomposition
For a null contrast \(\theta=0\), \[ \mathrm{SS}(\cv)=\frac{\hat\theta^2}{\sum_i c_i^2/n_i}, \qquad F_{\text{one contrast}}=\frac{\mathrm{SS}(\cv)}{\mathrm{MS_{res}}}=t^2. \]
Two estimated contrasts are uncorrelated precisely when \[ \sum_i\frac{c_i c_i'}{n_i}=0. \]
- Five mutually orthogonal contrasts partition the diet SS into five 1-df pieces.
- Non-orthogonal contrasts can be estimated and tested, but their sums of squares generally do not partition the diet SS.
C versus A and F versus A share the same reference mean. Their covariance is \(\sigma^2/57>0\): their sums of squares do not simply add.
Scheffé’s test for a contrast
For \(H_0:\theta=\sum_i c_i\mu_i=0\), with \(\sum_i c_i=0\), write \[ t_{\cv}=\frac{\hat\theta} {\sqrt{\mathrm{MS_{res}}\sum_i c_i^2/n_i}}. \]
Scheffé’s method rejects \(H_0\) when \[ |t_{\cv}|>\sqrt{(g-1)F_{g-1,N-g}^{1-\alpha}}, \qquad\text{equivalently}\qquad \frac{t_{\cv}^2}{g-1}>F_{g-1,N-g}^{1-\alpha}. \]
This controls the probability of any false rejection across all contrasts at level \(\alpha\), under the normal, common-variance model. It therefore also covers contrasts selected after examining the data.
Scheffé confidence intervals
Simultaneous \(100(1-\alpha)\%\) intervals for all contrasts are \[ \hat\theta\ \pm\ \underbrace{\sqrt{(g-1)F_{g-1,N-g}^{1-\alpha}}}_{\text{Scheffé multiplier}} \sqrt{\mathrm{MS_{res}}\sum_i\frac{c_i^2}{n_i}}. \]
For the six diets, the multiplier is \(\sqrt{5F_{5,343}^{0.95}}\).
These intervals are wider than pointwise \(t\) intervals because they cover all contrasts simultaneously. For comparisons only with A, Dunnett’s method gives narrower intervals.
Diet Restriction and Longevity: Scheffé test
Compare the average of groups C–F (the restricted diets) with A: \[ \theta=\frac{\mu_{\mathrm{C}}+\mu_{\mathrm{D}} +\mu_{\mathrm{E}}+\mu_{\mathrm{F}}}{4} -\mu_{\mathrm{A}}. \]
# Weights on the reference-coded parameters.
result = fit.t_test([0, 0, .25, .25, .25, .25])
effect = result.effect.item()
se = result.sd.item()
df = fit.df_resid
k = len(order) - 1
critical = np.sqrt(k * stats.f.ppf(.95, k, df))
p_scheffe = stats.f.sf((effect / se)**2 / k, k, df)

pd.Series({
    "Estimate (months)": effect,
    "SE (months)": se,
    "Scheffe lower": effect - critical * se,
    "Scheffe upper": effect + critical * se,
    "Adjusted p": p_scheffe
}).to_frame("Value")| Value | |
|---|---|
| Estimate (months) | 9.805092e+00 |
| SE (months) | 9.837196e-01 |
| Scheffe lower | 6.512712e+00 |
| Scheffe upper | 1.309747e+01 |
| Adjusted p | 2.122759e-17 |
Multiple comparisons and Type I error
We test groups B–F against A. Together, these tests form a family of comparisons.
\[ \mathrm{FWER}=\Pr(\text{at least one false rejection in the family}). \]
- Five independent level-0.05 tests would give \(1-0.95^5\approx0.226\).
- Our tests are dependent, because each uses the same reference group.
- The adjustment covers all five comparisons, including those we do not report.
Rejecting the omnibus null does not control the familywise error rate of unadjusted follow-up tests. Dunnett’s procedure controls this rate without a preliminary omnibus test.
Multiple-comparison procedures
| Comparisons included | Procedure | Scope of simultaneous inference |
|---|---|---|
| Groups B–F versus A | Dunnett | All five reference comparisons |
| All 15 pairwise diet differences | Tukey–Kramer | All pairs, allowing unequal \(n_i\) |
| \(K\) contrasts specified before examining the data | Bonferroni | All \(K\) contrasts |
| Any contrast, including one selected after seeing data | Scheffé | The entire contrast family |
Bonferroni uses \(t_{343}^{1-\alpha/(2K)}\) for two-sided intervals; Scheffé uses \(\sqrt{5F_{5,343}^{1-\alpha}}\).
Diet Restriction and Longevity: Dunnett comparisons
from scipy import stats

control = groups[0]  # A
dunnett = stats.dunnett(
    *groups[1:], control=control,
    alternative="two-sided",
    rng=np.random.default_rng(6160)
)
ci = dunnett.confidence_interval()
comparison = pd.DataFrame({
    "Difference": [
        y.mean() - control.mean()
        for y in groups[1:]
    ],
    "Lower": ci.low,
    "Upper": ci.high,
    "Adjusted p": dunnett.pvalue
}, index=order[1:])
comparison.round(3)| Difference | Lower | Upper | Adjusted p | |
|---|---|---|---|---|
| B | -5.289 | -8.572 | -2.007 | 0.0 |
| C | 9.606 | 6.609 | 12.602 | 0.0 |
| D | 10.194 | 7.024 | 13.365 | 0.0 |
| E | 6.994 | 3.824 | 10.165 | 0.0 |
| F | 12.425 | 9.309 | 15.542 | 0.0 |
Intervals have joint 95% coverage under the common-variance normal model. Positive differences mean longer average life than A.
Diet Restriction and Longevity: simultaneous intervals
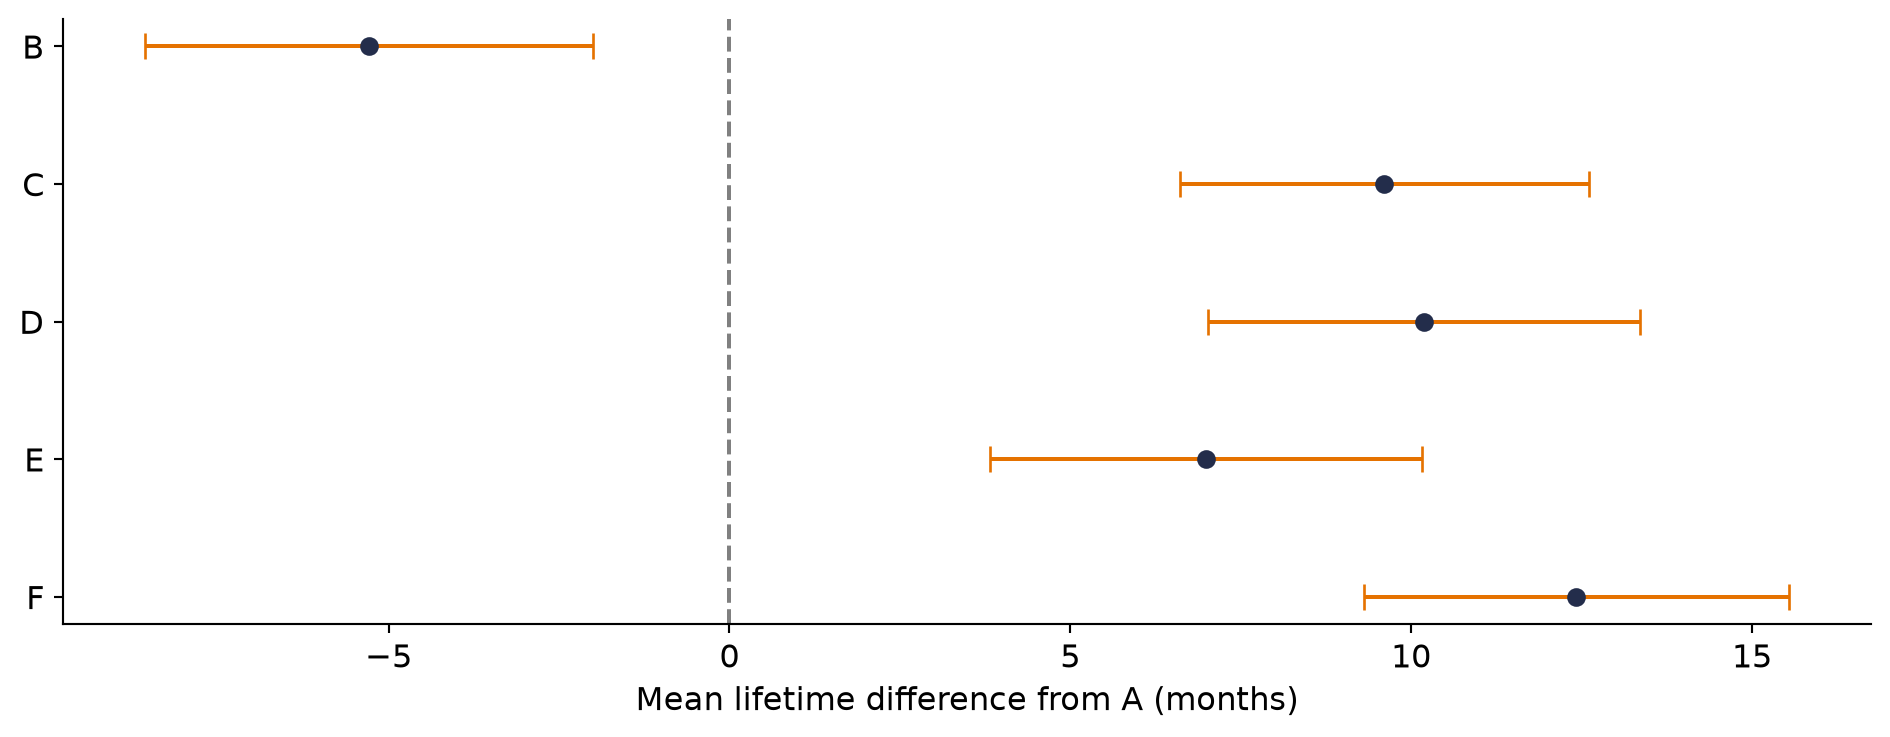
Which diets have longer mean lifetimes than A, and by how many months? An interval containing zero is not evidence that the two diets are equivalent.
Summary
- ANOVA: the data provide evidence against equality of the six diet means.
- C versus A (50 versus 85 kcal/week): the estimated mean difference is 9.61 months.
- Dunnett intervals: groups C–F have higher mean lifetimes than A; B has a lower mean.
These estimates apply to the mouse population and feeding conditions studied.
For next time
- What if mice differed systematically by litter, cage, or experimental batch?
- Pairing and blocking can account for known sources of variation.
- Including these sources of variation can reduce the residual variance.
References
Ramsey, Fred L., and Daniel W. Schafer. 2013. The Statistical Sleuth: A Course in Methods of Data Analysis. 3rd ed. Cengage Learning.
Weindruch, Richard, Roy L. Walford, Suzanne Fligiel, and Donald Guthrie. 1986. “The Retardation of Aging in Mice by Dietary Restriction: Longevity, Cancer, Immunity and Lifetime Energy Intake.” The Journal of Nutrition 116 (4): 641–54. https://doi.org/10.1093/jn/116.4.641.