A p = 0.014286 = 1/70 B p = 0.003906 = 1/256Introduction
STAT 6160 • Experimental Design • Fall 2026
Siddharth Vishwanath
2026-08-25
\[ \newcommand{\pa}[1]{\left(#1\right)} \newcommand{\pb}[1]{\left\{#1\right\}} \newcommand{\pc}[1]{\left[#1\right]} \newcommand{\pA}[1]{\Big(#1\Big)} \newcommand{\pB}[1]{\Big\{#1\Big\}} \newcommand{\pC}[1]{\Big[#1\Big]} \newcommand{\eq}[1]{\begin{align}{#1}\end{align}} \newcommand{\eref}[1]{Eq.~\eqref{#1}} \newcommand{\pref}[1]{part~(\ref{#1})} \newcommand{\nn}{\nonumber} \newcommand{\n}{\nonumber\\} \newcommand{\f}{\frac} \newcommand{\defeq}{\stackrel{\small\bullet}{=}} \newcommand{\ra}{\rangle} \newcommand{\la}{\langle} \newcommand{\norm}[1]{\left\|#1\right\|} \newcommand{\abs}[1]{\left\lvert#1\right\rvert} \newcommand{\Abs}[1]{\Bigl\lvert#1\Bigr\rvert} \newcommand{\pr}{{\mathbb P}} \newcommand{\qr}{{\mathbb Q}} \newcommand{\xv}{{\boldsymbol{x}}} \newcommand{\av}{{\boldsymbol{a}}} \newcommand{\bv}{{\boldsymbol{b}}} \newcommand{\cv}{{\boldsymbol{c}}} \newcommand{\dv}{{\boldsymbol{d}}} \newcommand{\ev}{{\boldsymbol{e}}} \newcommand{\fv}{{\boldsymbol{f}}} \newcommand{\gv}{{\boldsymbol{g}}} \newcommand{\hv}{{\boldsymbol{h}}} \newcommand{\nv}{{\boldsymbol{n}}} \newcommand{\sv}{{\boldsymbol{s}}} \newcommand{\tv}{{\boldsymbol{t}}} \newcommand{\uv}{{\boldsymbol{u}}} \newcommand{\vv}{{\boldsymbol{v}}} \newcommand{\wv}{{\boldsymbol{w}}} \newcommand{\zerov}{{\mathbf{0}}} \newcommand{\onev}{{\mathbf{1}}} \newcommand{\phiv}{{\boldsymbol{\phi}}} \newcommand{\cc}{{\check{C}}} \newcommand{\xv}{{\boldsymbol{x}}} \newcommand{\Xv}{{\boldsymbol{X}\!}} \newcommand{\yv}{{\boldsymbol{y}}} \newcommand{\Yv}{{\boldsymbol{Y}}} \newcommand{\zv}{{\boldsymbol{z}}} \newcommand{\Zv}{{\boldsymbol{Z}}} \newcommand{\Iv}{{\boldsymbol{I}}} \newcommand{\Jv}{{\boldsymbol{J}}} \newcommand{\Cv}{{\boldsymbol{C}}} \newcommand{\Ev}{{\boldsymbol{E}}} \newcommand{\Fv}{{\boldsymbol{F}}} \newcommand{\Gv}{{\boldsymbol{G}}} \newcommand{\Hv}{{\boldsymbol{H}}} \newcommand{\alphav}{{\boldsymbol{\alpha}}} \newcommand{\epsilonv}{{\boldsymbol{\epsilon}}} \newcommand{\betav}{{\boldsymbol{\beta}}} \newcommand{\deltav}{{\boldsymbol{\delta}}} \newcommand{\gammav}{{\boldsymbol{\gamma}}} \newcommand{\etav}{{\boldsymbol{\eta}}} \newcommand{\piv}{{\boldsymbol{\pi}}} \newcommand{\thetav}{{\boldsymbol{\theta}}} \newcommand{\tauv}{{\boldsymbol{\tau}}} \newcommand{\muv}{{\boldsymbol{\mu}}} \newcommand{\argmin}{\mathop{\text{arg}\ \!\text{min}}} \newcommand{\arginf}{\mathop{\text{arg}\ \!\text{inf}}} \newcommand{\argmax}{\mathop{\text{arg}\ \!\text{max}}} \newcommand{\argsup}{\mathop{\text{arg}\ \!\text{sup}}} \newcommand{\f}{\frac} \newcommand{\e}{\epsilon} \newcommand{\b}{\bullet} \newcommand{\inv}{^{-1}} \newcommand{\A}{{\mathcal A}} \newcommand{\C}{{\mathbb C}} \newcommand{\E}{{\mathbb E}} \newcommand{\F}{{\mathcal{F}}} \newcommand{\N}{{\mathbb N}} \newcommand{\R}{{\mathbb R}} \newcommand{\Q}{{\mathbb Q}} \newcommand{\Z}{{\mathbb Z}} \newcommand{\X}{{\mathbb{X}}} \newcommand{\Y}{{\mathbb{Y}}} \newcommand{\G}{{\mathcal{G}}} \newcommand{\M}{{\mathcal{M}}} \newcommand{\Xn}{X_1, \dots, X_n} \newcommand{\Xm}{X_1, \dots, X_m} \newcommand{\Yn}{Y_1, \dots, Y_n} \newcommand{\Ym}{Y_1, \dots, Y_m} \newcommand{\Xb}{{\mathbb{X}}} \newcommand{\Yb}{{\mathbb{Y}}} \newcommand{\s}{{{\sigma}}} %%%%%%%%%%%%%%%%%%%%%%%%%%% \newcommand{\c}{^c} \newcommand{\bar}{\overline} \newcommand{\indep}{\perp\kern-6pt \perp} \newcommand{\pr}{{\mathbb P}} \newcommand{\R}{{\mathbb R}} \newcommand{\E}{{\mathbb E}} \newcommand{\var}{\text{Var}} \newcommand{\sd}{\text{SD}} \newcommand{\se}{\text{SE}} \newcommand{\ssres}{{\mathrm{SS}_{\mathrm{Res}}}} \newcommand{\sstrt}{{\mathrm{SS}_{\mathrm{Trt}}}} \newcommand{\sstot}{{\mathrm{SS}_{\mathrm{Tot}}}} \newcommand{\rank}{\mathop{\mathrm{rank}}} \newcommand{\supp}{\text{supp}} \newcommand{\Unif}{{\text{Unif}}} \newcommand{\Ber}{{\text{Ber}}} \newcommand{\Bin}{{\text{Bin}}} \newcommand{\Geo}{{\text{Geo}}} \newcommand{\Poi}{{\text{Poi}}} \newcommand{\Exp}{{\text{Exp}}} \newcommand{\Chisq}{{\chi^2}} \newcommand{\iid}{{\stackrel{iid}{\sim}}} \newcommand{\px}{p_{X}} \newcommand{\py}{p_{Y}} \newcommand{\pxy}{p_{X,Y}} \newcommand{\fx}{f_{X}} \newcommand{\fz}{f_{Z}} \newcommand{\fy}{f_{Y}} \newcommand{\fxy}{f_{X,Y}} \newcommand{\Fx}{F_{X}} \newcommand{\Fz}{F_{Z}} \newcommand{\Fy}{F_{Y}} \newcommand{\Fxy}{F_{X,Y}} \newcommand{\Xbar}{\overline{X}} \newcommand{\Ybar}{\overline{Y}} \newcommand{\Zbar}{\overline{Z}} \newcommand{\nXbar}{n \cdot \overline{X}} \newcommand{\nYbar}{n \cdot \overline{Y}} \newcommand{\nZbar}{n \cdot \overline{Z}} \newcommand{\Xn}{X_1, X_2, \dots, X_n} \newcommand{\Xm}{X_1, X_2, \dots, X_m} \newcommand{\Ym}{Y_1, Y_2, \dots, Y_m} \newcommand{\sumXn}{X_1 + X_2 + \dots + X_n} \newcommand{\la}{\ell_\alpha} \newcommand{\ua}{u_\alpha} \newcommand{\at}{{\alpha/2}} %%\renewcommand{\hat}{\widehat} \newcommand{\mux}{\mu_{X}} \newcommand{\muy}{\mu_{Y}} \newcommand{\sx}{\sigma_{X}} \newcommand{\sy}{\sigma_{Y}} \newcommand{\pvalue}{$p$-value} \newcommand{\Ho}{H_{0}} \newcommand{\Ha}{H_{a}} \]
Lecture slides sidv23.github.io/stat-6160
To consult the statistician after an experiment is finished
is often merely to ask him to conduct a post mortem examination.
He can perhaps say what the experiment died of.
R. A. Fisher, 1938 (Fisher 1938)
Before Fisher
Three things that came first
1809 · Least squares, and the normal curve
Gauss and Laplace, fitting orbits to noisy measurements. How to draw a line through error, and why error piles up in a bell shape. (Gauss 1809)
1889 · Correlation and regression
Galton, then Karl Pearson. Variation stops being a nuisance and becomes the thing you study. (Galton 1889)
1908 · Small samples
Gosset, a brewer at Guinness, publishing as “Student”. Exact answers from a dozen observations, because barley trials don’t give you thousands. (Student 1908)
All three: what to do with data you already have.
A lady tasting tea
Rothamsted, early 1920s
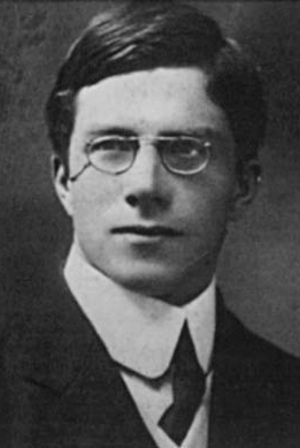
Fisher
statistician, in his 30s

Muriel Bristol
phycologist — she studied algae
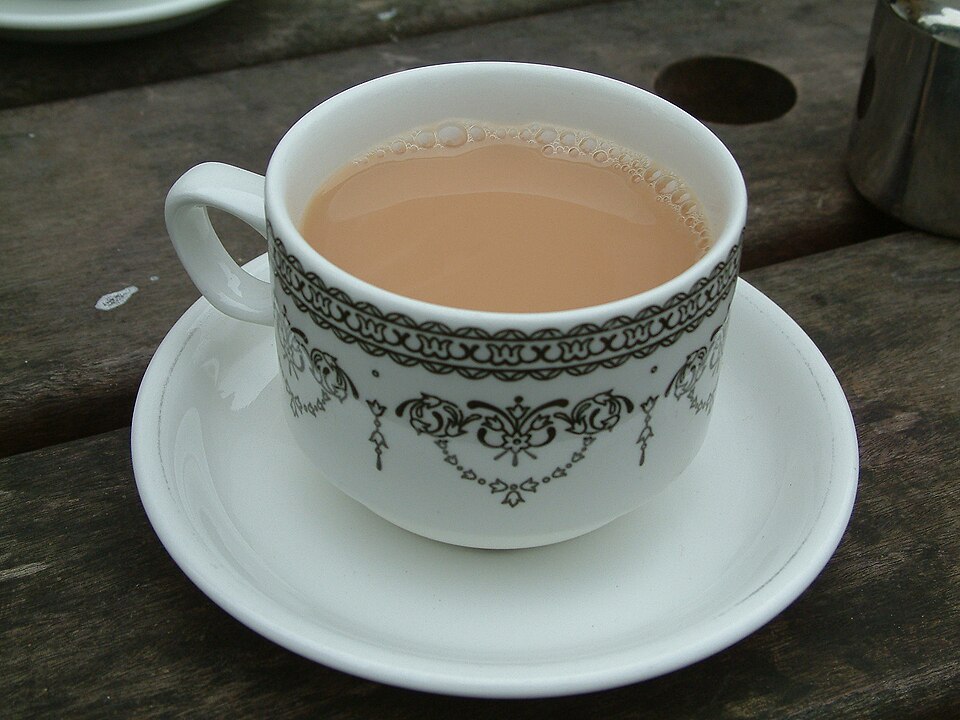
The tea
milk in first, or after
She turns down a cup. The milk went in after the tea, and she says she can tell.
The room laughs. Fisher asks the useful question: how would we find out?
The design
Eight cups. Four milk-first, four tea-first.
Random order, fixed by the experimenter before she tastes anything.
She’s told the split — four of each — and names the four milk-first cups.
If she’s guessing
Her four picks have nothing to do with the truth. So every way of choosing four cups from eight is equally likely:
\[ \binom{8}{4} = 70 \]
All four right? One outcome out of 70. \(\;p = 1/70 \approx 0.014\).
Two designs
Design A
Fix four and four. Tell her the split. She names four.
\(\binom{8}{4} = 70\) ways.
Design B
Randomize each cup on its own, milk-first with probability \(1/2\). She judges each cup separately.
\(2^8 = 256\) ways.
Which would you rather run?
Design A
she gets right
Design B
she gets right
What’s actually new
The null hypothesis is about the randomization, not a parameter of an assumed distribution. No normality, no large samples, no approximation
The probability comes from something the experimenter physically did. Fisher didn’t assume a model of the world — he made one by shuffling cups
So the \(p\)-value is exact, for a reason you can point at
And the design came first
The null hypothesis is never proved or established, but is possibly disproved, in the course of experimentation.
— Fisher, 1935
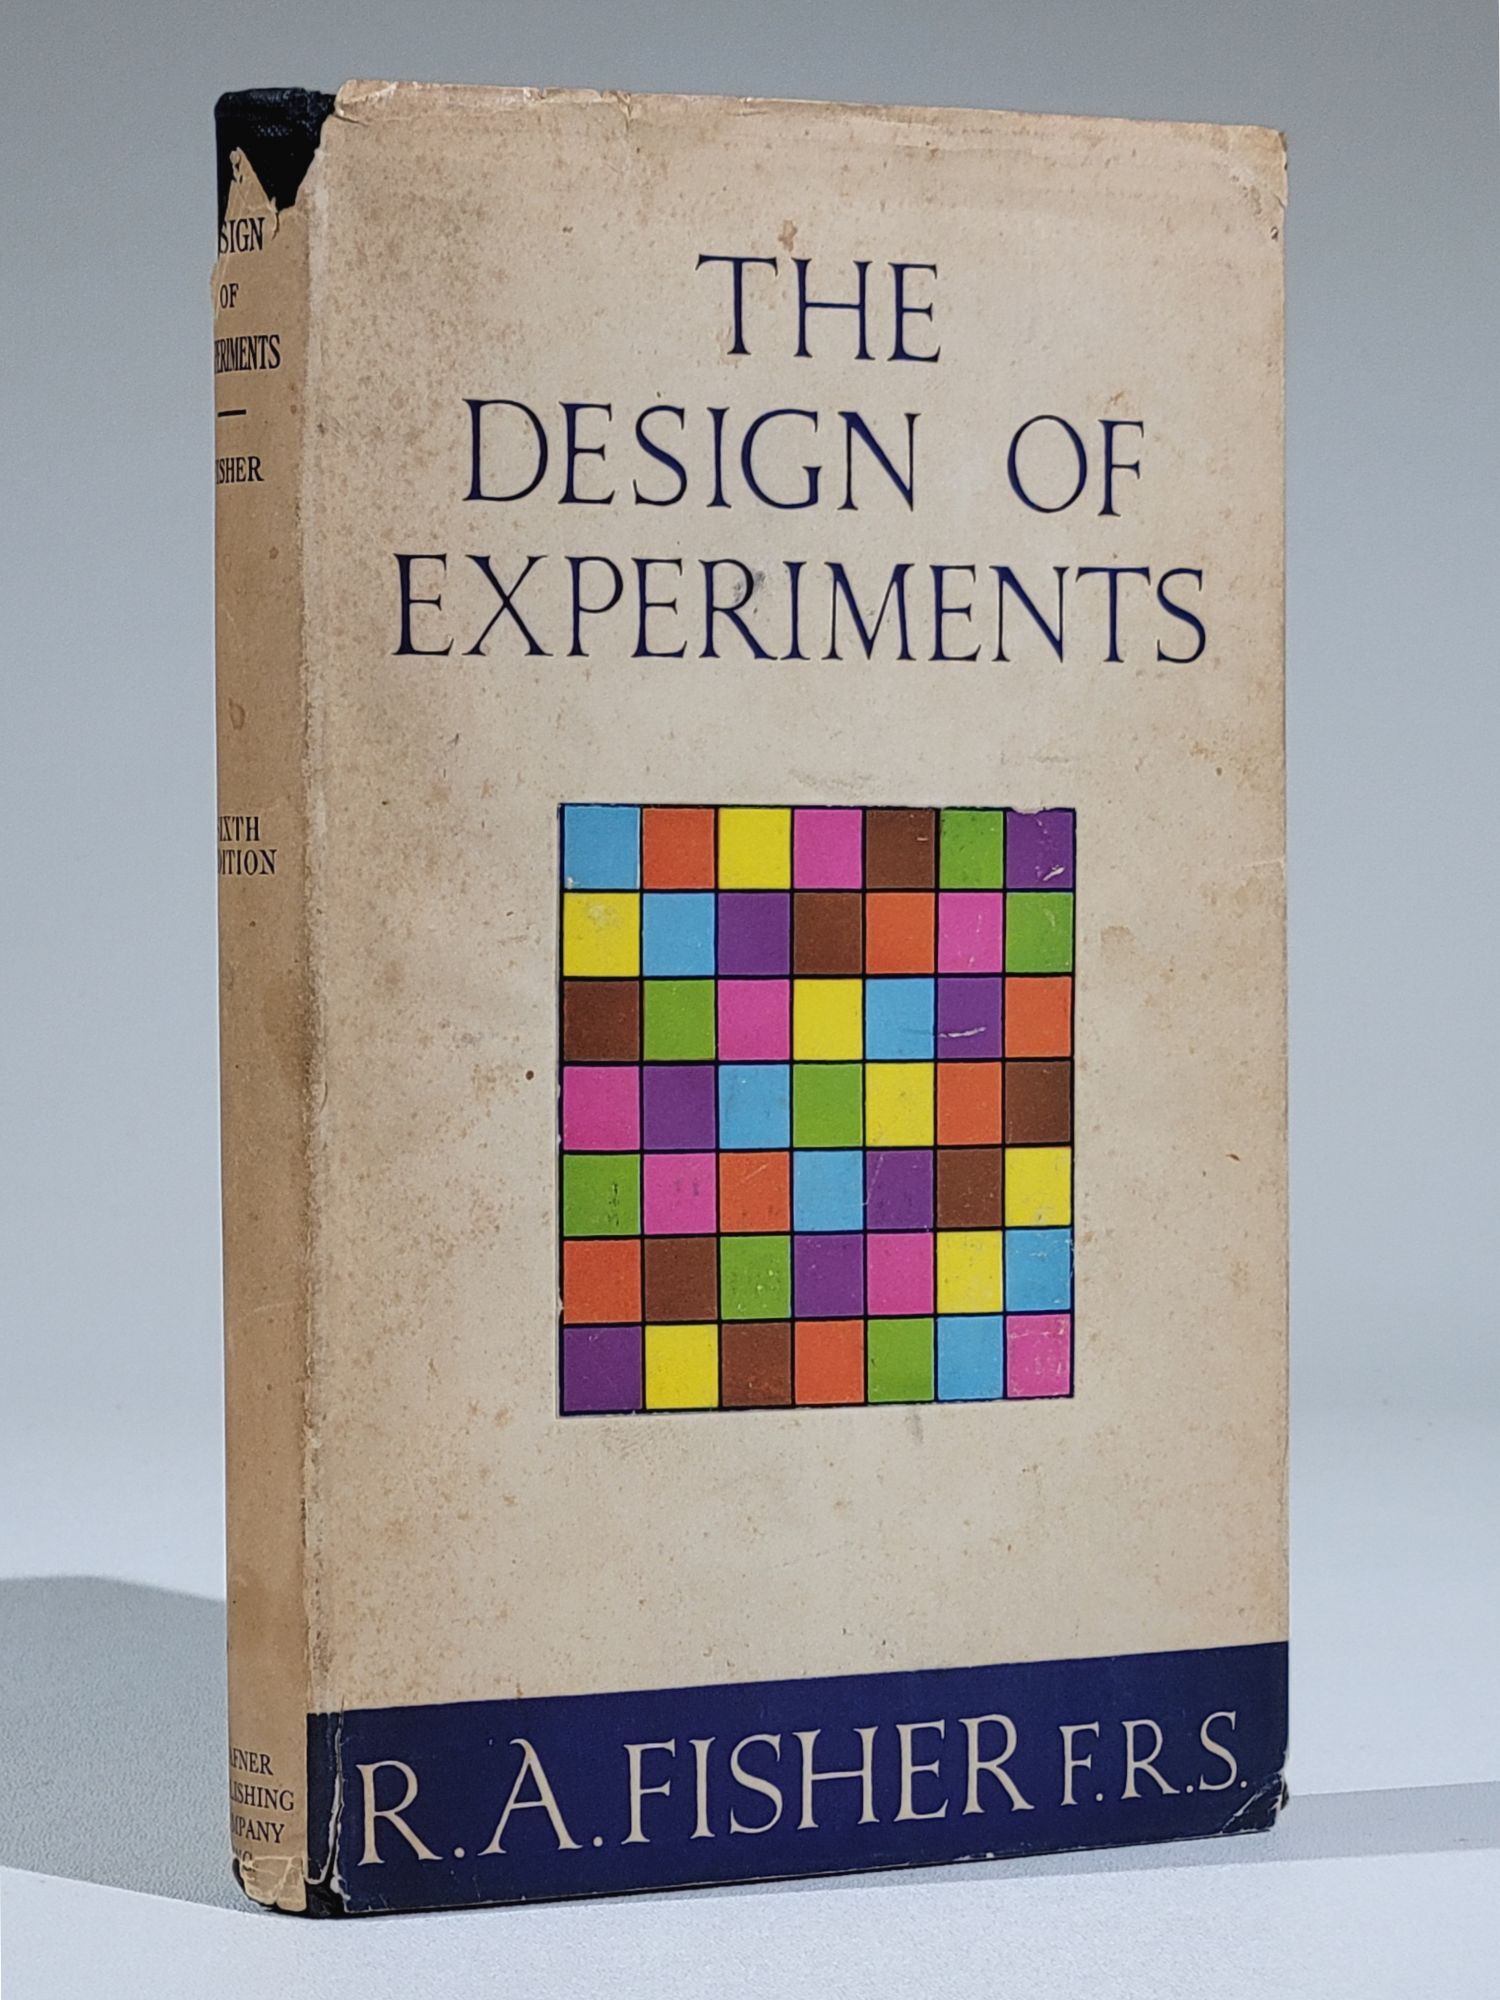
Ten years earlier: Statistical Methods for Research Workers (1925), which put these tools in the hands of people who weren’t statisticians (Fisher 1925). Every idea in the book was worked out for agriculture. All of them are now used to run experiments at companies that didn’t exist twenty years ago.
The other side
Fisher and tobacco

Fisher, 1952
1950s: Doll and Hill link smoking to lung cancer. In 1957 the Medical Research Council calls it cause and effect (Doll and Hill 1954).
Fisher disagrees, loudly. Letters to the BMJ in 1957, then a book in 1959 (Fisher 1959).
His argument: nobody randomized anything. The correlation is real, but some genetic factor could cause both the urge to smoke and the cancer.
He was also a paid consultant to the Tobacco Manufacturers’ Standing Committee, which funded the genetic work.
He was a pipe smoker.
He was wrong (Stolley 1991).
Double-edged
The same rigour that stops you believing too easily can be used to manufacture doubt
Some things can’t be randomized. That doesn’t mean nothing can be known about them
Being rigorous and being right are not the same thing
Who pays you shapes what you’re willing to doubt
Now
Where it shows up
- Tech
-
A/B tests, interleaving, switchback designs, marketplaces where units interfere
- Medicine
-
adaptive and platform trials, interim monitoring, dose-finding
- Industry
-
response surfaces, robust design, process optimization
- Machine learning
-
hyperparameter search, benchmark design, active learning, evals
- Policy
-
field experiments, stepped-wedge rollouts
- Science
-
computer experiments, self-driving labs, screening
Same question, bigger budget: what should we do next?
Bandits
Fisher fixes the assignment before any data arrives. But if one treatment is better, every unit sent to the worse arm costs something real, e.g., a patient, a customer, millions of dollars $$$.
Bandits make assignment a decision: use what you’ve learned to choose what to do next.
Older than it looks. Thompson, 1933; motivated by clinical trials, two years before Fisher’s book (Thompson 1933).
The catch
- Data no longer exchangeable
- Sample means come out biased
- No reference distribution you can write down in advance
Efficiency, paid for in inferential simplicity.
Response surfaces
Sometimes the question isn’t whether a factor matters. It’s where to set the dial (how to choose your hyperparameters).
Box and Wilson, 1951: fit a cheap local model, walk along steepest ascent, refit, and only near the optimum spend budget on a design that resolves curvature (Box and Wilson 1951).
The experiment becomes a search, which is run in stages.
Where it went
- Bayesian optimization: Gaussian processes and surrogate models
- Hyperparameter optimization, black-box optimization
- Materials discovery, self-driving labs
- Systems autotuning
The acquisition function does what steepest ascent did.
Sequential designs
Wald, 1947 — why fix the sample size at all? Stop when the evidence is decisive. Cut wartime inspection costs sharply (Wald 1947).
Descendants: group-sequential trials with interim looks, and platform trials that add and drop arms while running.
RECOVERY, 2020
One platform trial, 11,000+ hospitalized Covid patients, several arms at once.
Found within months that dexamethasone cut mortality in ventilated patients (The RECOVERY Collaborative Group 2021).
A cheap off-patent steroid was found fast because of the design.

This course
Objectives
- Design for credible comparisons
- Randomization, replication, blocking. Separating the effect from everything else.
- Understand variation
- Which sources matter, which to control by design, and how that changes the analysis.
- Find interactions
- Not just whether a treatment works; when, where, and under what conditions.
- Work computationally
- Design, simulate, check assumptions, and communicate with real tools.
The plan
- Randomization, replication, blocking
the randomization test, done properly - Single-factor experiments
ANOVA, contrasts, multiple comparisons - Blocking designs
randomized blocks, Latin squares, incomplete blocks - Factorial experiments
main effects and interactions - Two-level and fractional designs
confounding, aliasing, resolution, screening - Response surfaces and after
optimization, sequential and adaptive designs
TL;DR: Start where Fisher started. End roughly where the field is.
Logistics
Essentials
| Class | Tue & Thu, 9:30–10:45 AM |
| Room | Physics Building 217 |
sidv@virginia.edu — subject starts [STAT 6160] |
|
| Office hours | TBD — once I know my schedule |
| Assumed | inference, linear algebra, linear models |
Turned in
Weekly summaries — Sundays, 11:59 PM
a short reproducible write-up
Weekly quizzes — Thu, in class
Homework — deadline date, 11:59 PM
Project — a real design, proposed and carried out
Everything else is on the course website.
Software
This course is programming language agnostic.
Python
Use whichever you like
The important thing is that it has to run … on someone else’s machine … without you in the room.
Getting it across
Statistical lifecycle
Design
What to collect, from whom, assigned how.
Mistakes here are permanent.
Analyze
Fit, test, estimate, quantify.
Mistakes here are cheap, rerun it or use a different methodology.
Communicate
Make it legible, checkable, reusable.
Mistakes here make the other two moot.
Reading a claim, the four questions:
What was randomized? What was the reference set? What was pre-specified? How many things were tested before this one got reported?
Frictionless reproducibility
An article about computational science in a scientific publication is not the scholarship itself, it is merely advertising of the scholarship. The actual scholarship is the complete software development environment and the complete set of instructions which generated the figures.
Three practices, in an unusually strong form:
- FR-1 · Data
- “datafication of everything, with a culture of research data sharing”
- FR-2 · Re-execution
- “research code sharing including the ability to exactly re-execute the same complete workflow by different researchers”
- FR-3 · Challenges
- “adopting challenge problems as a new paradigm powering scientific research”
The currency of discourse today is Frictionless Reproducibility. Researchers are thinking: Can’t I just try this now?
Suppose you’re a mathematical scientist who thought of your job as mathematically describing a data science procedure and creating a theorem work, or you’re in a non-mathematical field, let’s say in medicine, that does not currently use one or more legs of the triad. Work to change this, for example instituting the sharing of data and code and documenting performance
— Donoho, Data Science at the Singularity,
Harvard Data Science Review 6(1), 2024
In this course
Weekly summaries and the project are documents that regenerate themselves: code and prose in one file
Set your seeds. A randomized design you can’t reproduce is a story, not an experiment
Version it. “The one I emailed Tuesday” isn’t a version
Write so a stranger can rerun you. Usually that stranger is you in four months, remembering nothing
A designed experiment is a claim about what you’d find again.
For Thursday
- Get Python or R running on your machine
- Bring a question about an experiment you’d actually like to run
sidv@virginia.edu
make sure your email subject starts with [STAT 6160]
References
Box, George E. P., and K. B. Wilson. 1951. “On the Experimental Attainment of Optimum Conditions.” Journal of the Royal Statistical Society, Series B 13 (1): 1–45.
Doll, Richard, and A. Bradford Hill. 1954. “The Mortality of Doctors in Relation to Their Smoking Habits: A Preliminary Report.” British Medical Journal 1 (4877): 1451–55.
Fisher, Ronald A. 1925. Statistical Methods for Research Workers. Oliver; Boyd.
Fisher, Ronald A. 1938. “Presidential Address to the First Indian Statistical Congress.” Sankhyā: The Indian Journal of Statistics 4 (1): 14–17.
Fisher, Ronald A. 1959. Smoking: The Cancer Controversy. Some Attempts to Assess the Evidence. Oliver; Boyd.
Galton, Francis. 1889. Natural Inheritance. Macmillan.
Gauss, Carl Friedrich. 1809. Theoria Motus Corporum Coelestium in Sectionibus Conicis Solem Ambientium. Perthes; Besser.
Salsburg, David. 2001. The Lady Tasting Tea: How Statistics Revolutionized Science in the Twentieth Century. W. H. Freeman.
Senn, Stephen. 2012. “Tea for Three: Of Infusions and Inferences and Milk in First.” Significance 9 (6): 30–33.
Stolley, Paul D. 1991. “When Genius Errs: R. A. Fisher and the Lung Cancer Controversy.” American Journal of Epidemiology 133 (5): 416–25.
Student. 1908. “The Probable Error of a Mean.” Biometrika 6 (1): 1–25.
The RECOVERY Collaborative Group. 2021. “Dexamethasone in Hospitalized Patients with Covid-19.” New England Journal of Medicine 384 (8): 693–704.
Thompson, William R. 1933. “On the Likelihood That One Unknown Probability Exceeds Another in View of the Evidence of Two Samples.” Biometrika 25 (3–4): 285–94.
Wald, Abraham. 1947. Sequential Analysis. John Wiley & Sons.